Setting up
EV charging is a complex process. With many different vehicles and chargers, we would expect to see a range of compatibility issues and charging speeds.
Understanding and solving problems requires data, and this is where the 3-phase AC PAM (Power Analysis Module) comes in. The 3-phase AC PAM (Power Analysis Module) plays a crucial role in understanding and solving these problems. This module is designed to collect and analyze data related to the three-phase alternating current (AC) power, providing valuable insights into the performance and efficiency of the power system.
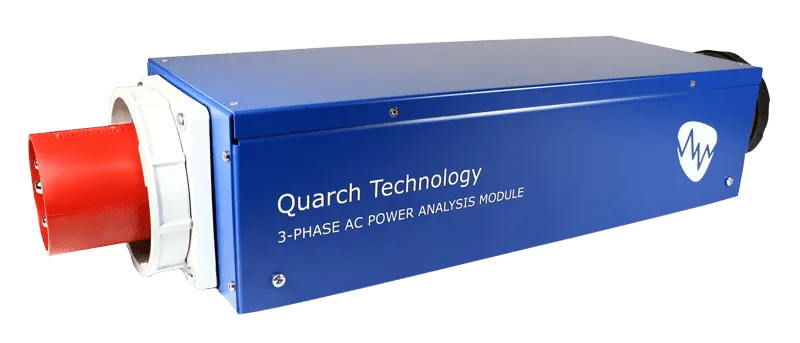
This device can capture high-resolution AC traces for long periods of time.
- 8,000 Samples per second
- 16, 32 and 63-amp versions
- Plug-and-play setup
- Manual and fully automated capture options
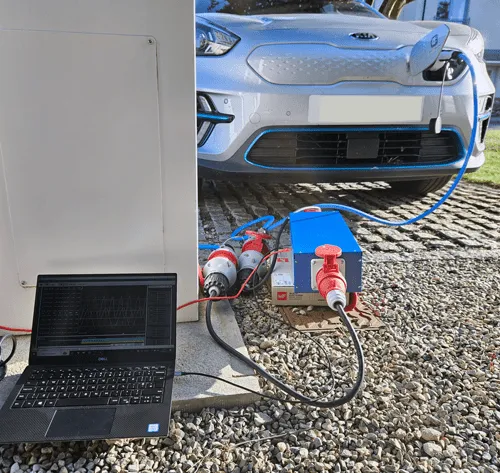
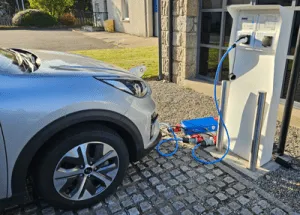
In this instance, we used an EV KIA and plugged the AC PAM in series with the charging cable.
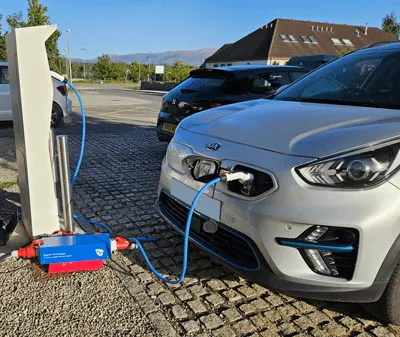
We’re using the 16Amp version of the product here, which matches the rating of the charger (An evolt charger connected to a 16A, 3-phase supply)
This takes just a few seconds to set up, though I did use a custom that bypasses the PP/CP as without this, the EV could not communicate with the charger.
The laptop is running Quarch Power Studio, our capture/visualisation software
Output voltage and current
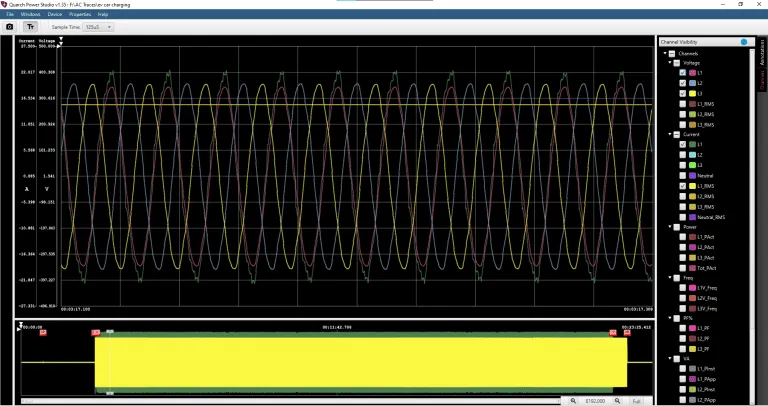
The first thing we see is that the charger has the ability to switch its output on and off; it does not output a voltage until it communicates with the car and begins the charge cycle.
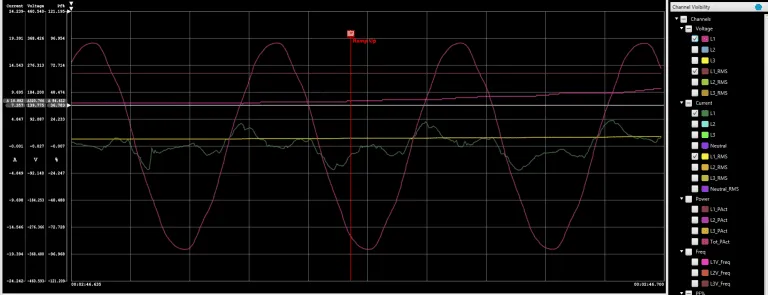
We also see above that voltage is applied on all 3 phases, but the EV only takes current on phase 1.
Zooming in further, we can see the current waveform is pretty good, and adding the ‘power factor’ channel gives us a 99.4% power factor during this point in the charge.
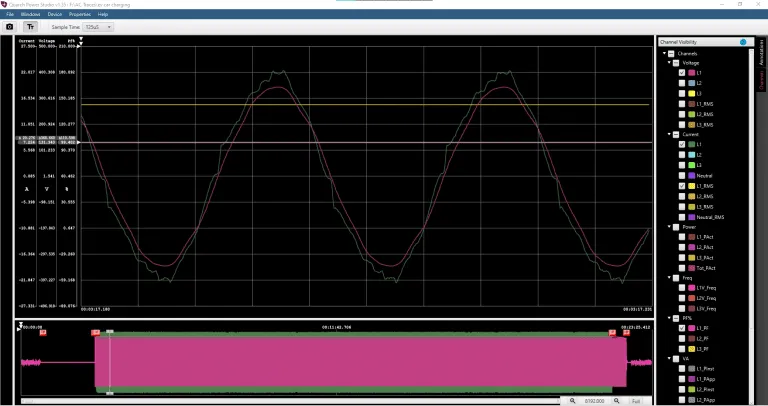
Interestingly, the AC waveform from the charger is not perfect.
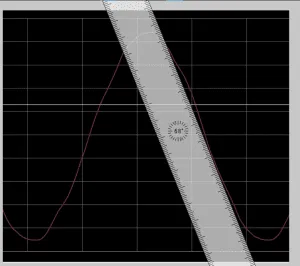
There is a clear distortion, and this is seen all the time, even when no significant current is drawn. Additional testing would be needed to confirm if this is an artifact of the charger or if the AC supply to the entire site shows the same effect!
Starting the charge cycle
Moving on to the charge cycle, lets look at the start-up
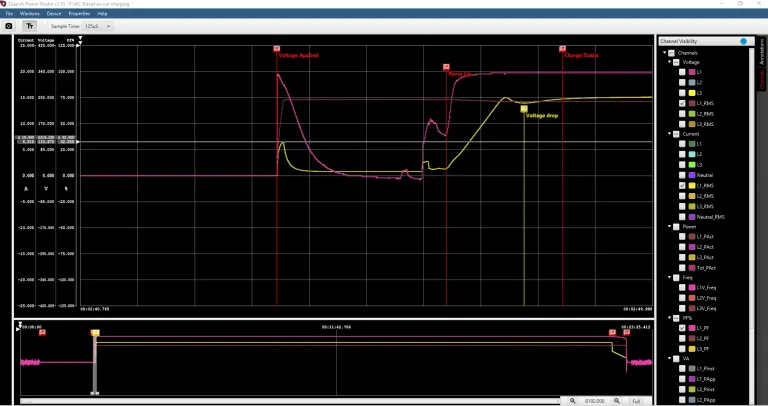
The brown trace is the RMS voltage, which rises rapidly at the start of the charge and remains steady until the very end. We do see a small voltage drop as the current draw ramps up, though (annotated in yellow). This is just over 6 volts drop.
The yellow trace is RMS current. We see an inrush spike to 6.5A followed by a couple of seconds of delay before we ramp up to the 15.1 Amp charging current that remains steady for the full test.
The purple trace is Power Factor. This is invalid at the start, as no voltage is applied, but we do see an interesting step as the current ramps up:
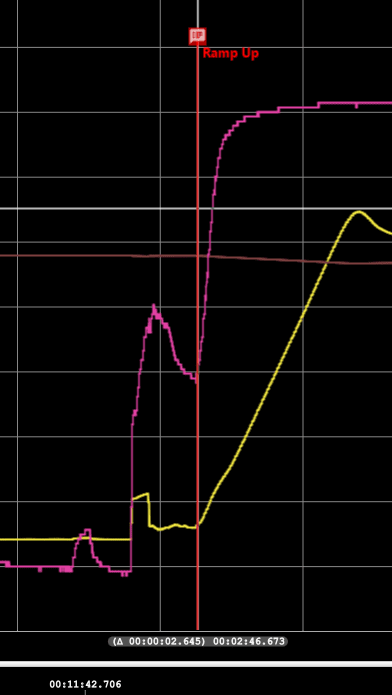
The (green) current trace is not at all clean at this point, which would explain the poor power factor
End of charging
The battery was already well charged, so the cycle only ran for about 20 minutes. Towards the end of this time, the charger slows the charge across a 32-second period:
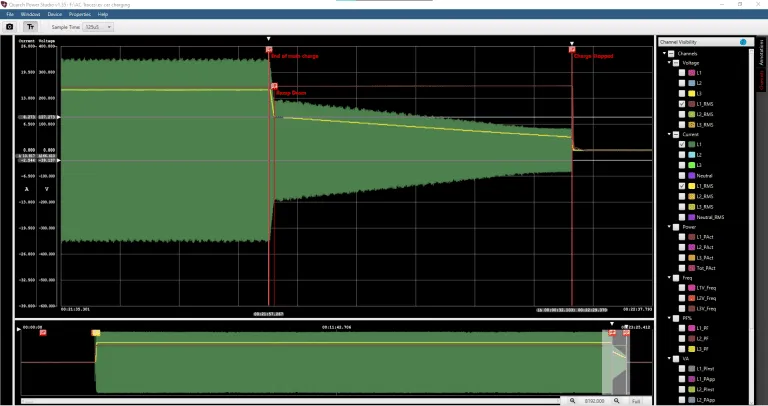
The current waveform is in green, and the RMS current is in yellow. We can see it first drops from 14.9A to 8.2A over 486mS. Next, it steps down slowly in 150mA increments until it reaches 3.3A. It then turns off completely.
Contact your local reseller or email support@quarch.com to get started!


Post a Comment